MaxMart Expess Sales Performance Analysis
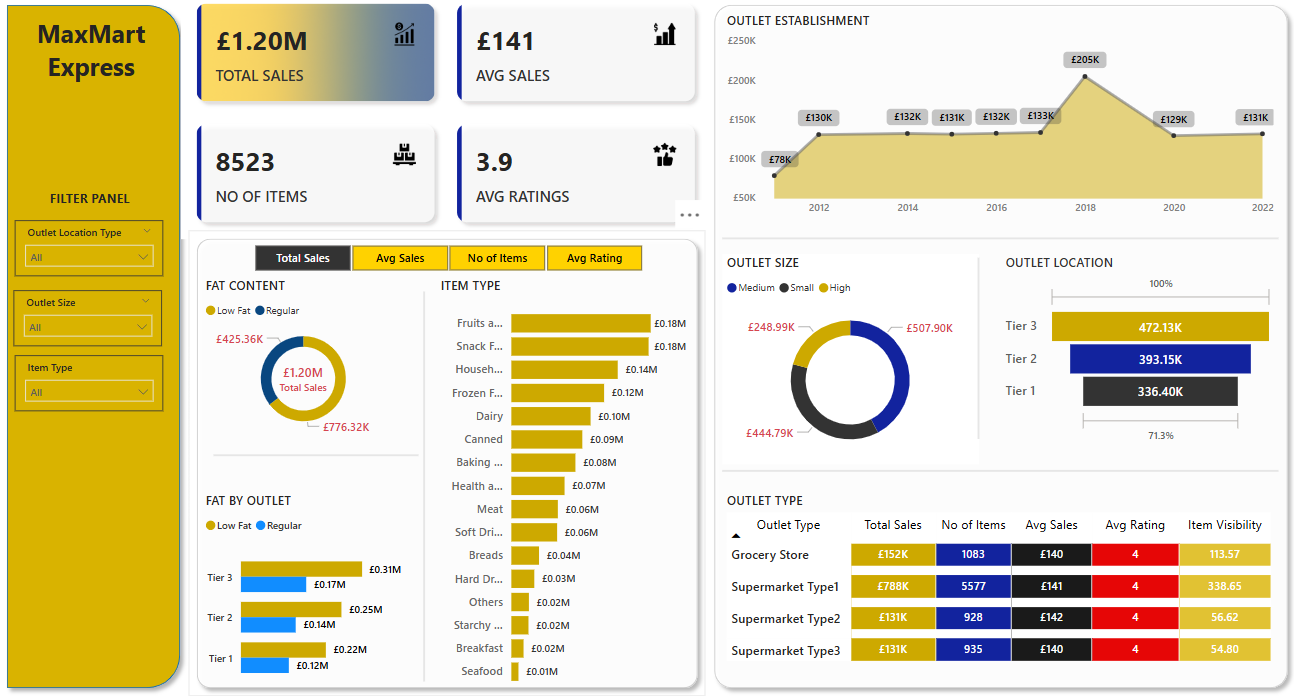
Table of contents
Objective
To conduct a comprehensive analysis of MaxMart sales performance, customer satisfaction, and inventory distribution to identify key insights and opportunities for optimization using various KPIs and visualization in Power BI.
To create a dashboard that provides insights into MaxMart Express performance analysis with KPIs requirements such as:
- Total Sales: The overall revenue generated from all items sold.
- Average Sales: The average revenue per sales.
- Number of Items: The total amount of different items sold.
- Average Rating: The average customer rating for items sold.
This will help the company make informed decisions about how to improve sales and customer satisfaction.
Data source
- What data is needed to achieve our objective?
We need data that includes their
- Item Fat Content
- Item Type
- Outlet Establishment Year
- Outlet Location Year
- Outlet Size
- Outlet Type
- Sales
- Rating
Stages
- Design
- Developement
- Testing
- Analysis
Design
Dashboard components required
- What should the dashboard contain based on the requirements provided?
To understand what it should contain, we need to figure out what questions we need the dashboard to answer:
1.Total sales by Fat Content 2.Total sales by Item Type 3.Fat Content by Outlet for Total sales 4.Total Sales by Outlet Establishment 5.Sales by Outlet size 6.Sales by Outlet Location 7.All metrics by Outlet type
For now, these are some of the questions we need to answer, this may change as we progress down our analysis.
Tools
| Tool | Purpose |
|---|---|
| Excel | Exploring the data, Data Cleaning and Data Visualization |
| Power BI | Cleaning data, and Visualizing the data via interactive dashboards |
| GitHub | Hosting the project documentation and version control |
Development
Pseudocode
- What’s the general approach in creating this solution from start to finish?
- Get the data
- Explore and clean the data in Excel
- Load the data into Power BI
- Clean the data with Power BI
- Test the data with Power BI
- Visualize the data in Power BI
- Generate the findings based on the insights
- Write the documentation + commentary
- Publish the data to GitHub Pages
Analysis
Discovery
I noticed that;
- Sales and Revenue i. Supermarket Type1 outlets dominate sales with £788K, including strong performance. ii. Tier 3 locations contribute the highest revenue, making up 71.3% of total sales. iii. Sales peaked in 2018 (£205K) and have since declined – possible signs of operational or external market shifts.
- Inventory & Product Performance i. High revenue is driven by Fruits & Vegetables and Snack Foods (£0.18M each). ii. Low performing items like Seafood, Breakfast, and Starchy Foods contribute less than £0.02M – potential overstocking risk.
- Outlet Performance i. High size outlets generate the most sales (£507.9K) showing scalability. ii. Small outlets underperform, generating £248.99K, needing deeper evaluation.
- Customer Satisfaction i. Average rating is 3.9, with all outlet types consistently rated 4.0, suggesting uniform service but opportunities to push higher.
Recommendations
- Sales and Expansion i. Focus expansion and promotions on Tier 3 regions and Supermarket Type1 outlets. ii. Investigate the sales drop post 2018 to uncover operational or market challenges.
- Inventory Optimization i. Reduce investment in underperforming product categories (e.g., Seafood). ii. Reallocate shelf space to top-selling categories like Fruits & Snacks.
- Customer Satisfaction i. Collect qualitative customer feedback to improve the rating from 3.9 to 4.5+. ii. Introduce loyalty programs and feedback incentives at top outlets to retain and grow the customer base.
- Outlet Review i. Audit small outlets for efficiency and relevance – consider consolidating or upgrading to medium-size format where feasible.
Action Plan
| Area | Action Item | Owner | Timeline | | — | — | — | — | | Sales | Deep-dive into sales trend post-2018 | Sales Analyst | 2 Weeks | | Inventory | Phase out low-selling SKUs and restock top performers | Inventory Manager | 1 Month | | Customer Experience | Launch customer satisfaction survey and analyze results | CX Team | 3 Weeks | | Outlet Strategy | Evaluate underperforming small outlets for upgrade or closure | Operations Lead | 1 Month | | Marketing | Launch geo-targeted campaigns in Tier 3 areas | Marketing Team | 2 weeks |
Visualization
Results
- What does the dashboard look like?